
Pumpdown Curves Explained: How to Read & Use Them for Diagnostics
Learn to read pumpdown curves and use them to diagnose vacuum system problems. Examples and information along with a complete guide with real examples from 25+ years of service.
3 min read
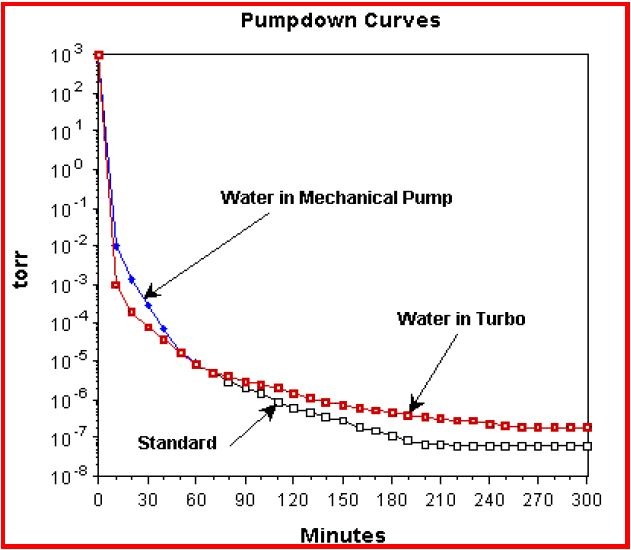
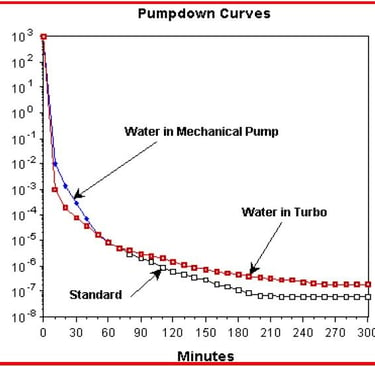
A pumpdown curve is a graph. The X-axis is time. The Y-axis is pressure. The line that goes down is your system reaching vacuum.
It looks simple. But buried in that curve is every secret your vacuum system is keeping.
What a Good Pumpdown Curve Looks Like
A healthy system has a characteristic shape:
0-10 seconds: Steep drop from 760 Torr to ~50 Torr (roughing pump removing atmosphere fast)
10 seconds-1 minute: Continuing drop from 50 Torr to ~0.1 Torr (still fast, but slowing)
1-5 minutes: Shallow drop from 0.1 Torr to 10⁻⁵ Torr (turbo pump or turbomolecular pump ramping up)
5-20 minutes: Very shallow drop from 10⁻⁵ Torr to base pressure (cryopump taking over, asymptotic curve)
The shape matters more than the absolute numbers. A curve that follows this pattern means your system is working correctly at each stage.
Reading a Curve: Pressure vs. Pumping Speed
Pressure changes because pumping speed is dropping as you go deeper into vacuum. This is normal. Different pump types dominate at different pressure ranges:
Roughing pump dominates at 760-1 Torr
Turbo pump dominates at 1-0.001 Torr
Cryopump dominates below 0.001 Torr
When you see a "flat spot" in the curve (pressure stalls for a while), it usually means you're at a transition between pump types. That's okay - it just means the next pump is starting to take over.
Diagnosing Problems from Curve Shape
Problem 1: Curve Diverges High (Around 100 Torr)
Your roughing pump isn't working well. Could be:
Backing pump failure
Rotary vane pump cavitation (oil level too low)
Bad valve or connection between roughing pump and main system
Problem 2: Curve Flattens Between 1-10 Torr and Won't Drop Further
Your turbo pump isn't starting or isn't reaching full speed. Could be:
Turbo motor failure
Magnetic bearing fault
Low inlet pressure (roughing pump not getting you low enough)
Problem 3: Curve Diverges Below 0.01 Torr
Your cryopump isn't working. Could be:
Coldhead not reaching temperature (cooling problem)
Charcoal array saturated (needs regeneration)
Helium circuit contamination (ratchetting, ice, moisture)
Problem 4: Curve Reaches Base Pressure But Pressure Creeps Back Up Over Hours
You have a leak or virtual leak. Could be:
Real leak in a fitting, seal, or weld
Virtual leak (outgassing from chamber walls, trapped water, absorbed gases)
Pump degradation (charcoal array saturation, absorbed gases in array)
Using Comparison Curves
The real power of pumpdown curves is comparison.
Get a baseline curve from your system when it's working well. Save it. Then every 6 months, run a new pumpdown curve and overlay it on your baseline.
Perfect match? Your system is fine.
Diverges at the same spot each time? That's your problem area - focus diagnostics there.
Progressively getting worse? Time for preventive maintenance.
Annotating Your Curve
When you run a pumpdown curve, note:
Time of day and date
Roughing pump type and operating condition
Turbo pump speed (if variable)
Cryopump model and coldhead temperature
Any audible sounds (ratchetting, vibration, etc.)
Recent maintenance or repairs
This context helps you (and your service provider) interpret the shape accurately.
Real-World Example: Contaminated Cryopump
We once saw a curve that looked fine down to 10⁻⁴ Torr, then flatlined completely. The customer thought the cryopump was broken.
Turns out: the charcoal array was saturated from back-to-back regeneration cycles (they'd been running the pump hard). One full regen cycle restored the curve to normal. No replacement needed. Cost: zero (besides the operator's time).
A curve told us that story. Without it, they would have shipped the pump back for rebuild.
How to Capture Your Curve
Most modern systems have data logging built in. On-Board pumps use WinOCC, which records pressure and temperature continuously. Older systems require a pressure gauge and a stopwatch.
Pro tip: Use a logarithmic scale on the Y-axis (pressure). It makes the curve shape much clearer.
Your Curve is Your Map
We've been reading pumpdown curves for 25+ years. If you have one - or if you're struggling to create one - send it to us. We can tell you what it means and what to do next.
Contact Us
Support and inquiries welcome anytime.
Phone
sales@appliedcryogenics.com
1-510-252-9900
© 2026. All rights reserved.